在VBA宏模块中编写代码其实并不是想象中的那么难,虽然代码看上去比较啰嗦复杂,但是如果你利用“录制宏”的功能来生成代码就非常容易了,然后再对生成的代码进行适当修改,代码是按照你的操作步骤一步一步生成的,每一步你的操作与代码对应,这样很容易修改生成的代码。
录制宏:
找到视图下的宏,找到录制功能:
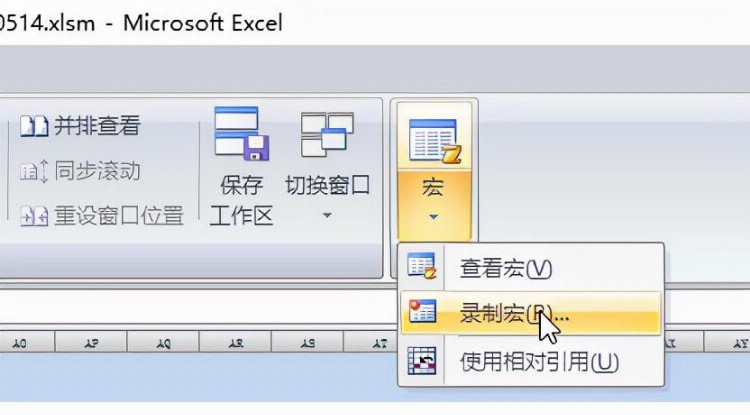
录制宏模块
给宏取名:
按功能输入宏模块的名称:
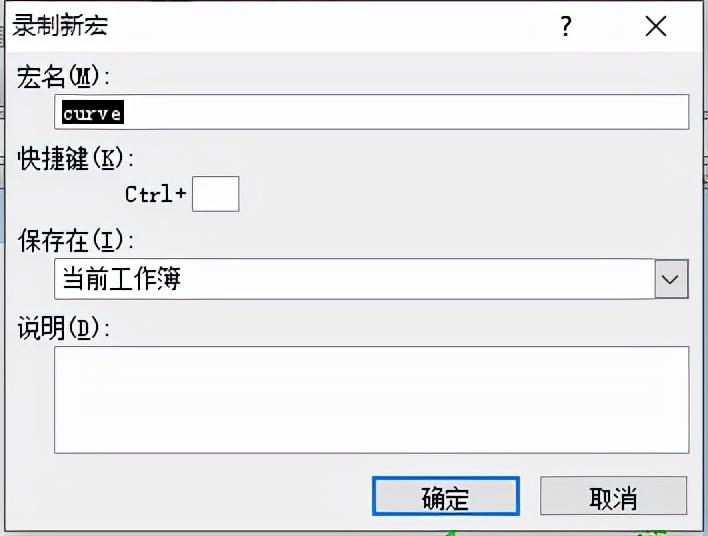
给宏模块命名
手动作图:
先用手动选择数据画想要生成的图形:
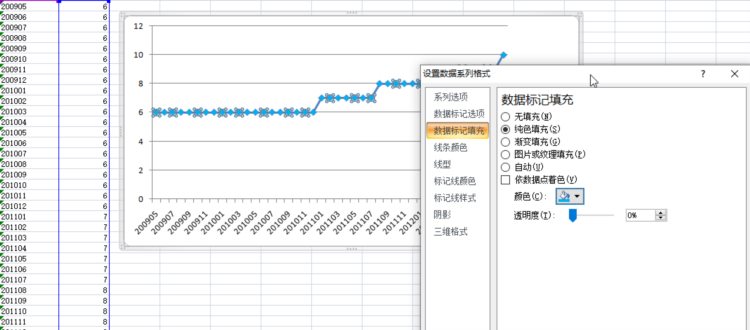
先用手动选择数据画想要生成的图形
停止录制:
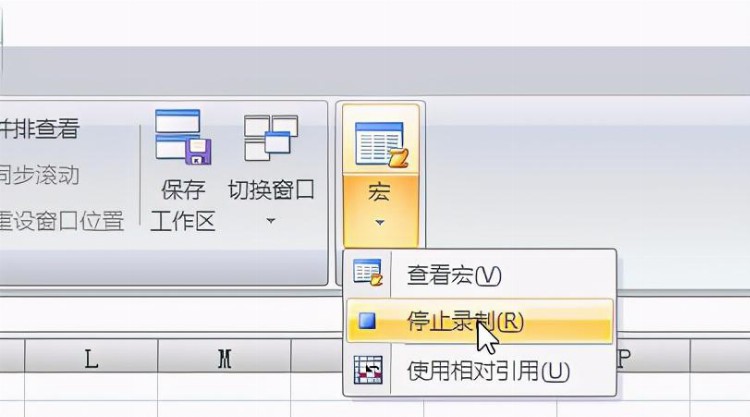
画好图后停止录制宏
查看宏:
找到名称,点编辑进入代码窗口:
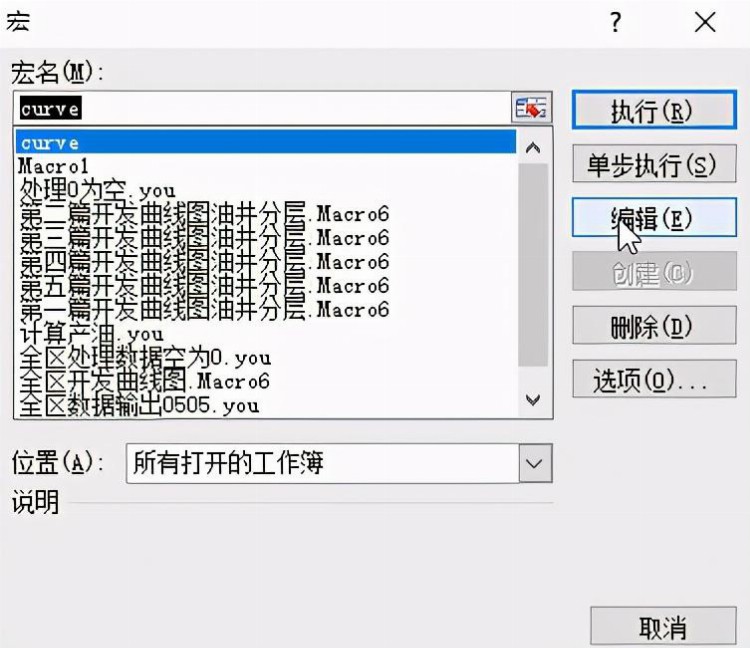
编辑宏代码
点开编辑,查看系统自动生成的代码:
Sub curve()
    Range("G702:H744").Select
    ActiveSheet.Shapes.AddChart.Select
    ActiveChart.SetSourceData Source:=Range("数据1!$G$702:$H$744")
    ActiveChart.ChartType = xlLineMarkers
    ActiveChart.SeriesCollection(1).Select
    ActiveSheet.ChartObjects("图表 1").Activate
    ActiveSheet.ChartObjects("图表 1").Activate
    ActiveChart.Axes(xlCategory).Select
    ActiveSheet.ChartObjects("图表 1").Activate
    ActiveChart.Axes(xlCategory).Select
    ActiveChart.Axes(xlCategory).TickLabelSpacing = 1
    ActiveChart.Axes(xlCategory).TickLabelSpacing = 3
    ActiveChart.Axes(xlCategory).TickLabelSpacing = 5
End Sub
Range("G702:H744").Select:选择数据范围
ActiveSheet.Shapes.AddChart.Select:当前激活表插入图形
ActiveChart.SetSourceData Source:=Range("data1!$G$702:$H$744"):选择源数据
ActiveChart.ChartType = xlLineMarkers:图形类型选折线类型
ActiveChart.SeriesCollection(1).Select:选择系列
ActiveSheet.ChartObjects("图表 1").Activate:激活图表
ActiveChart.Axes(xlCategory).Select:选择坐标轴
ActiveChart.Axes(xlCategory).TickLabelSpacing = 5:坐标轴文本标签间隔设置为5
可以看出,你的每一步操作都自动生成了代码,而且是严格对应的,有些方法和属性你不知道怎么用,但是如果录制宏自动生成代码,你就知道怎么调用和引用了,这样下一步对于我们来修改程序,批量选择数据,批量生成多个曲线奠定了基础。
下面对8个数据表同时操作,生成曲线图:
数据简单处理:把数据为0的值都处理成空值,在画图的时候越过这些值
处理代码:
Sub dataOperation()
    Dim str3()
    str3() = Array("", "data1", "data2", "data3", "data4", "data5", "data6", "data7", "data8")
    For m = 2 To 24 Step 2
        For j = 2 To 200
            If Sheets(str3(5)).Cells(j, m) = 0 Then
                For i = 1 To 8
                    Sheets(str3(i)).Cells(j, m).ClearContents
                Next i
            End If
        Next j
    Next m
End Sub
新生成列数据(用已有列数据进行自动计算):
Sub dataCreate()
    str1 = "源数据": str2 = "F": str3 = "I": str4 = "L": str5 = "J": str6 = "K": str7 = "G"
    For i = 2 To 1761
        If Sheets(str1).Cells(i, str2) > 0 And Sheets(str1).Cells(i, str3) = " " Then
            Sheets(str1).Cells(i, str3) = Sheets(str1).Cells(i, str2) / Sheets(str1).Cells(i, str4)
            Sheets(str1).Cells(i, str5) = 0
            Sheets(str1).Cells(i, str6) = 100 - Sheets(str1).Cells(i, str5) / Sheets(str1).Cells(i, str3) * 100
        End If
    Next i
End Sub
画图代码:
通过录制宏,然后手动修改宏,再额外加一些简单的循环代码,实现多表和多图操作
Sub imageCreate()
    "定义数组变量:
    Dim str1(1 To 12), str3()
    Dim y(1 To 12)
    Dim ysz()
    "按照实际对8个或者更多个数据表进行作图:
    mm8 = 1
    str3() = Array("", "data1", "data2", "data3", "data4", "data5", "data6", "data7", "data8")
    ysz() = Array(0, 7, 3, 10, 32, 28, 28, 4, 32)
    "每个循环代表对一个数据表进行作图
    For i2 = 1 To 8
        "激活相应数据表
        Select Case i2
               Case i2
                    Sheets(str3(i2)).Activate
        End Select
        m = 64
        For i1 = 1 To 12
             Select Case i2
               Case i2
                    Sheets(str3(i2)).Activate
        End Select
        "数据区域选择:
        str2 = Chr(i1 + m)
        y(i1) = Application.WorksheetFunction.CountA(Range(CStr(str2) + "1" + ":" + CStr(str2) & "10000"))
        str1(i1) = CStr(str2) + "1" + ":" + CStr(Chr(i1 + m + 1)) & CStr(y(i1))
        m = m + 1
        Range(str1(i1)).Select
        "对图形进行相应操作,包括图形类型,线型,颜色,系列名称,标记大小、图名等:
        ActiveSheet.Shapes.AddChart.Select
        With Selection
            .Shadow = False
        End With
        ActiveChart.SetSourceData Source:=Range(str3(i2) + "!" + "$" + str2 + "$2:$" + CStr(Chr(i1 + m)) + "$" + CStr(y(i1)))
        ActiveChart.ChartType = xlLineMarkers
        ActiveChart.Legend.Select
        Selection.Delete
        ActiveChart.SeriesCollection(1).Name = "=" + """ + str3(i2) + """ + "!" + "$" + str2 + "$1"
        ActiveChart.Location Where:=xlLocationAsObject, Name:="曲线图" + CStr(mm8)
        ActiveChart.SeriesCollection(1).Select
        ActiveChart.SeriesCollection(1).Smooth = True
        With Selection.Border
            .ColorIndex = ysz(i2)
            .Weight = xlMedium
            .LineStyle = xlContinuous
        End With
        With Selection
            .MarkerBackgroundColorIndex = ysz(i2)
            .MarkerForegroundColorIndex = ysz(i2)
            .MarkerStyle = xlDiamond
            .Smooth = ture
            .MarkerSize = 5
            .Shadow = False
        End With
        ActiveChart.ChartArea.Select
        "删除标题,如果想实现某一功能,可能通过录制宏然后再修改代码
        If i2 <> 6 Then
        ActiveChart.ChartTitle.Select
        Selection.Delete
        End If
        If i2 <> 4 Then
        With Selection.Border
            .LineStyle = 0
        End With
        With ActiveChart
            .HasAxis(xlCategory, xlPrimary) = False
            .HasAxis(xlValue, xlPrimary) = True
        End With
        ActiveChart.Axes(xlCategory, xlPrimary).CategoryType = xlAutomatic
        ActiveChart.Axes(xlValue).Select
        With Selection.Border
            .ColorIndex = 57
            .Weight = xlMedium
            .LineStyle = xlContinuous
        End With
        ElseIf i2 = 4 Then
        With Selection.Border
            .LineStyle = 0
        End With
        ActiveChart.Axes(xlCategory, xlPrimary).CategoryType = xlAutomatic
        ActiveChart.Axes(xlValue).Select
        Selection.TickLabels.NumberFormatLocal = "0_ "
        "设置标记线样式
        With Selection
        .TickLabels.NumberFormatLocal = "0_ "
            .MajorTickMark = xlInside
        End With
        With Selection.Border
            .ColorIndex = 57
            .Weight = xlMedium
            .LineStyle = xlContinuous
        End With
         With Selection
            .MajorTickMark = xlInside
            .MinorTickMark = xlNone
            .TickLabelPosition = xlNextToAxis
        End With
        ActiveChart.Axes(xlCategory).Select
        With Selection.Border
            .ColorIndex = 57
            .Weight = xlMedium
            .LineStyle = xlContinuous
        End With
        End If
        With ActiveChart.Axes(xlCategory)
            .HasMajorGridlines = False
            .HasMinorGridlines = False
            .MajorTickMark = xlInside
        End With
        With ActiveChart.Axes(xlValue)
            .HasMajorGridlines = False
            .HasMinorGridlines = False
            .MajorTickMark = xlInside
        End With
        ActiveChart.PlotArea.Select
        With Selection.Border
            .Weight = xlThin
            .LineStyle = xlNone
        End With
        "对图表和曲线相应设置进行操作
        Selection.Interior.ColorIndex = xlNone
        ActiveChart.Axes(xlValue).Select
        ActiveChart.PlotArea.Select
        ActiveChart.ChartArea.Select
        ActiveSheet.Shapes(ActiveSheet.Shapes.Count).IncrementLeft 278.41
        ActiveSheet.ChartObjects(ActiveSheet.Shapes.Count).Activate
        ActiveChart.ChartArea.Shadow = False
        "对曲线显示位置操作
        ActiveChart.ChartArea.Select
        ActiveSheet.Shapes(ActiveSheet.Shapes.Count).IncrementLeft 660 * i1
        If i2 <> 5 And i2 <> 6 And i2 <> 7 And i2 <> 8 Then
        ActiveSheet.Shapes(ActiveSheet.Shapes.Count).IncrementTop 70 * (i2 + 3)
        End If
        If i2 = 5 Then
        ActiveSheet.Shapes(ActiveSheet.Shapes.Count).IncrementTop 70 * (0 + 3)
        End If
         If i2 = 6 Or i2 = 7 Or i2 = 8 Then
        ActiveSheet.Shapes(ActiveSheet.Shapes.Count).IncrementTop 70 * (i2 - 6)
        End If
        ActiveSheet.Shapes(ActiveSheet.Shapes.Count).ScaleWidth 1.8, msoFalse, msoScaleFromTopLeft
        ActiveSheet.Shapes(ActiveSheet.Shapes.Count).ScaleHeight 0.38, msoFalse, msoScaleFromTopLeft
        Next i1
    Next i2
End Sub
点击运行模块代码:
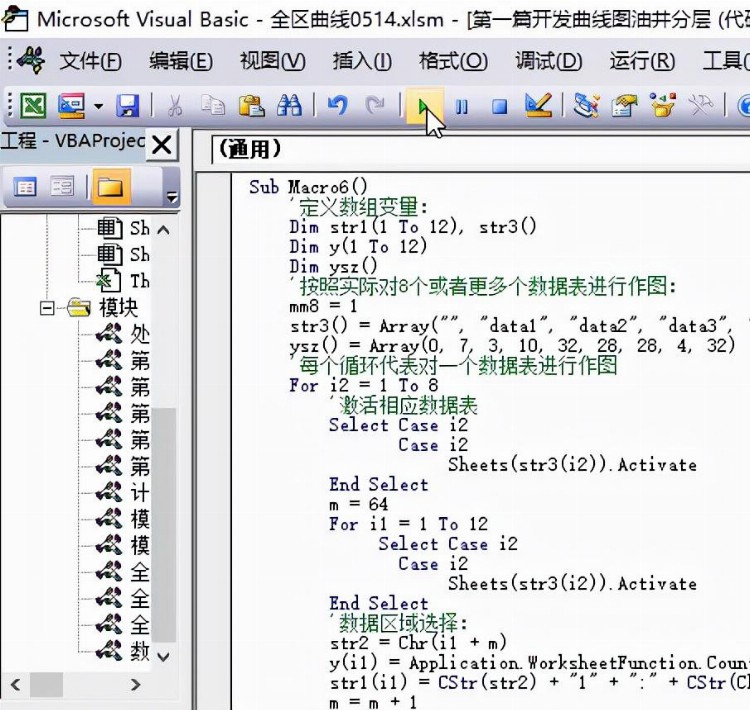
点击运行
宏代码模块
运行完毕,打开EXCEL,批量图形展现于此:
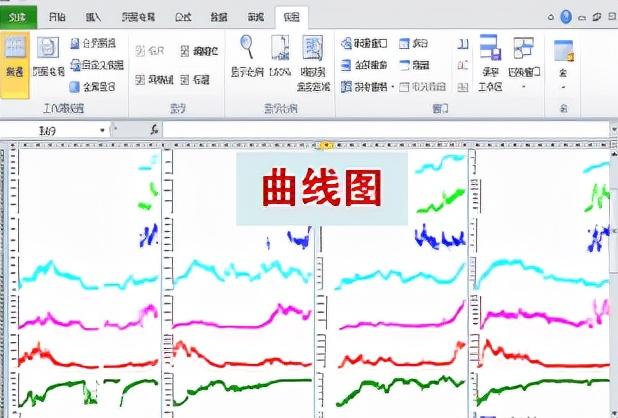
数百个曲线图自动一次成图
研究开发Excel中VBA宏模块自动调用Excel的图表制作功能,自动生成数百个曲线图,并且能够根据成图数据自动设置坐标数值、字体及大小、曲线图的形状、颜色及显示方式等参数,实现曲线图的快速成图和自动调整外观及坐标参数。
还可以应用VB程序开发工具编写程序自动从服务器提取和处理需要的数据,按特定格式输出到Excel数据表格中,通过编写宏代码,应用Excel中VBA宏模块调用Excel的图表制作功能,自动生成曲线图,并通过编写VB程序代码设定特定格式数据,通过编写VBA宏模块代码调用数据进行图自动的生成和自动参数设置,实现多组曲线图快速生成和快速坐标及外观设置的目的。
进阶思想:
要想从数据提取,生成新的数据,再到批量成图,需要有完整的思路
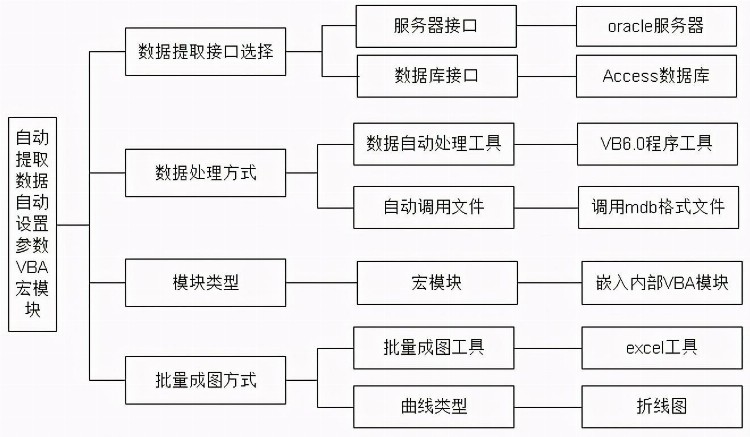
功能分类设计图
实现流程图:
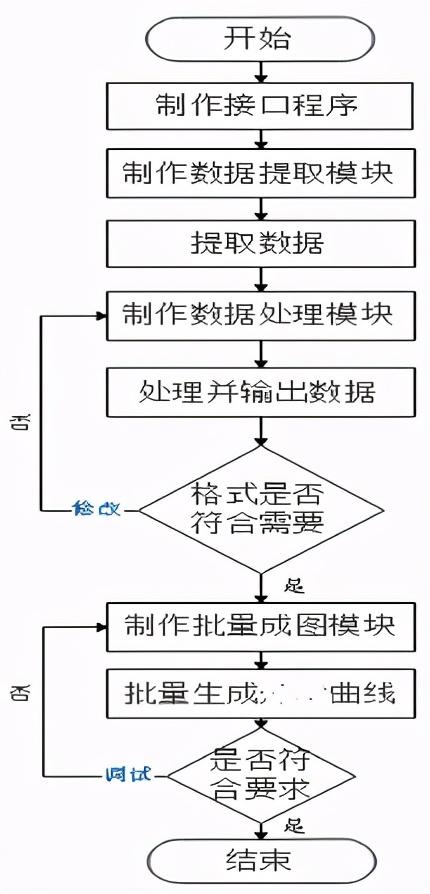
实现流程图
成功自动生成数据后,导入VBA模块:
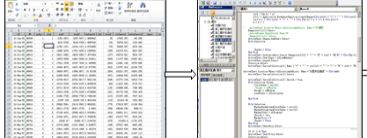
生成数据,导入模块
运行模块
